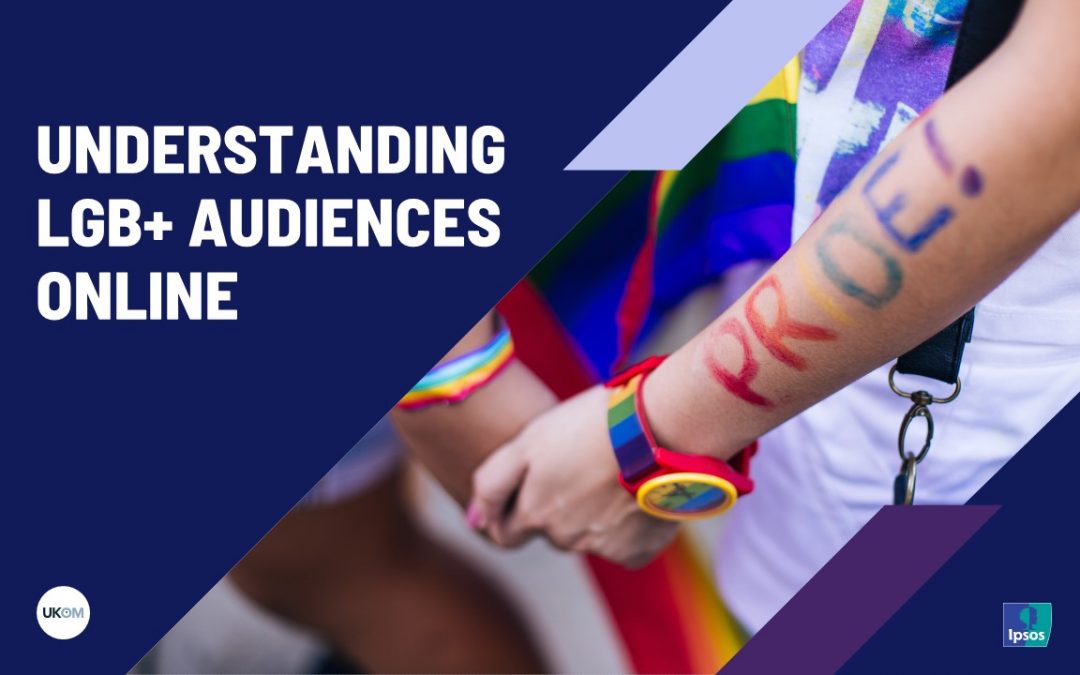
During Pride month last year, we added sexual orientation data to Ipsos iris, to help profile internet users that identify as lesbian, gay, bisexual or that identify in another way (LGB+)*. This data can help iris users better understand and serve LGB+ audiences online.
One way they can do this is by looking across the topline categories in Ipsos iris, to identify the areas where LGB+ audiences are most active online.
Top 10 highest affinity categories: LGB+ internet users indexed vs total internet population
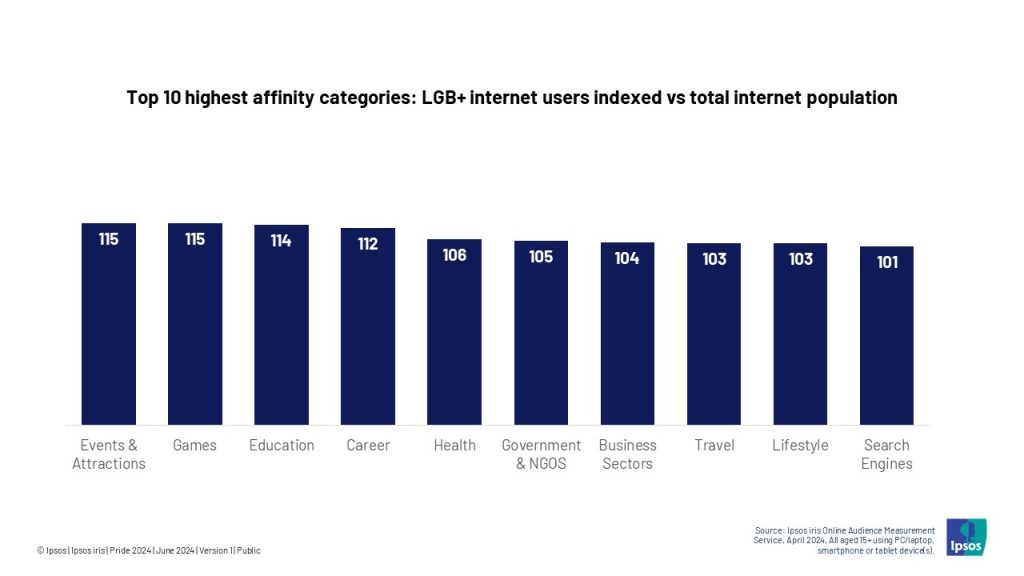
For example, in April 2024, LGB+ internet users were most likely to visit the events and attractions category (+15%) when compared to the total internet population, just ahead of games (+15%) and education (+14%).
And when we look at the subcategories within events and attractions, we can see that LGB+ audiences were even more likely to visit sites and apps across music, theatre and the arts.
Events & Attractions subcategories: LGB+ Internet users indexed vs total internet population
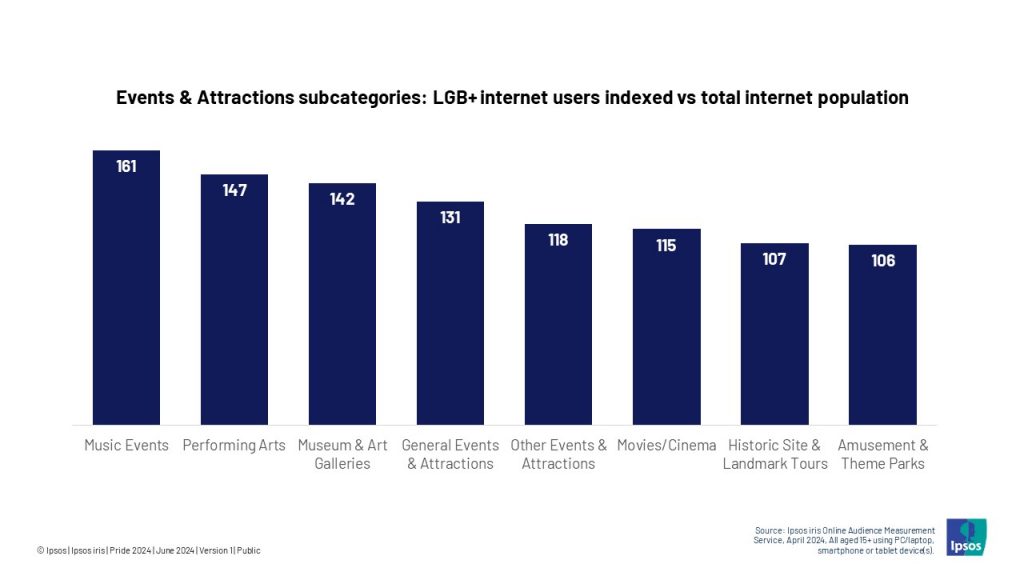
Music, in particular, emerges as a point of interest, with LGB+ audiences 61% more likely to have visited the music events category in April compared to the total internet population. They were more likely to visit some of the biggest live music and ticketing brands including Ticketmaster (+47%), Axs (+97%) and Songkick (+111%).
Our data also shows that LGB+ internet users’ affinity for the arts extends beyond music to the world of theatre. They were 47% more likely to visit performing arts sites and apps, with the average LGB+ visitor spending 12% longer browsing the category in April compared to all internet users.
Additionally, LGB+ audiences are significantly more likely to browse museums and art gallery brands online: 11% of the LGB+ online population engaged with content related to museums and art galleries in April, compared to an overall figure of 8% for all internet users.
Tate is the biggest brand in the category by audience, and our data shows that LGB+ visitors are an important segment for them. While just over one in ten internet users identifies as LGB+ (11%), almost one in four (24%) online visitors to Tate identify as such.
We can see synergies too: alongside content on events and days out, LGB+ audiences are also more likely to access content on eating out, too. They were 23% more likely to visit restaurants and pubs online in April compared to all internet users, and spent 10% longer browsing too.
This is just scratching the surface of one category where we can see high affinities with LGB+ audiences. But it already shows how profiling LGB+ internet users can help brands to better understand, reach and include an LGB+ audience.
*LGB+ is defined by the Office of National Statistics as “an abbreviation used to refer to people who identify as lesbian, gay, bisexual, and other minority sexual orientations (for example, asexual)”. You can read more here.